![]() Rick Wright
Rick Wright
Online Trading Academy
Hello traders! This week’s newsletter comes to you from snowy and sunny Colorado, where I have officially semi-retired. What does semi-retirement really mean? Well, I still get to write these newsletters every few weeks, and Online Trading Academy is still kind enough to get me around the country to cool towns to spread the gospel according to St. Market. If all I did was stay at home and trade in this snowy tundra, I would go stir crazy!
The reason I bring this up is that a couple of weeks ago I was in Boston, Massachusetts teaching one of our three-day Market Timing Orientation classes, and a student had an interesting question about conventional technical analysis.
His question was a common one: “What do you think about moving averages?” My answer was the same as it always is when someone asks about conventional technical analysis. “It depends. Does it help you or hurt you making money in the markets? Every ‘technique’ has its time and place, but most people don’t know how to use these tools properly.”
As we have discussed in previous newsletters, most of these indicators lag the market, which basically means they are late to the party. A couple of extremely basic rules of using moving averages, as found in all of the trading books ever written, is to go long when the moving averages are pointing up, when price hits the moving average; also, the trader should go short when the moving averages are pointing down, when price hits the moving average.
Fair enough, but let’s look at a chart to see how this would work in the real world. In the following USDJPY 30-minute chart on the left, I’ve marked an obvious supply zone and an obvious demand zone. (As a reminder, our core strategy states to sell in quality supply and buy in quality demand.) The chart on the left shows only a couple of the supply and demand levels for clarity sake. The chart on the right shows two common moving averages that some traders use, the 20 exponential and 50 exponential. For an in-depth explanation on these moving average see this article by Rick Wright.
The OTA student using our core strategy could have used the indicated supply to go short twice, once at the red arrow marked 1, a second time at the red arrow marked 2. (The original demand level is even farther back in time, but again, for clarity sake.) This same student could also have gone long at the demand level where the blue arrows are marked.
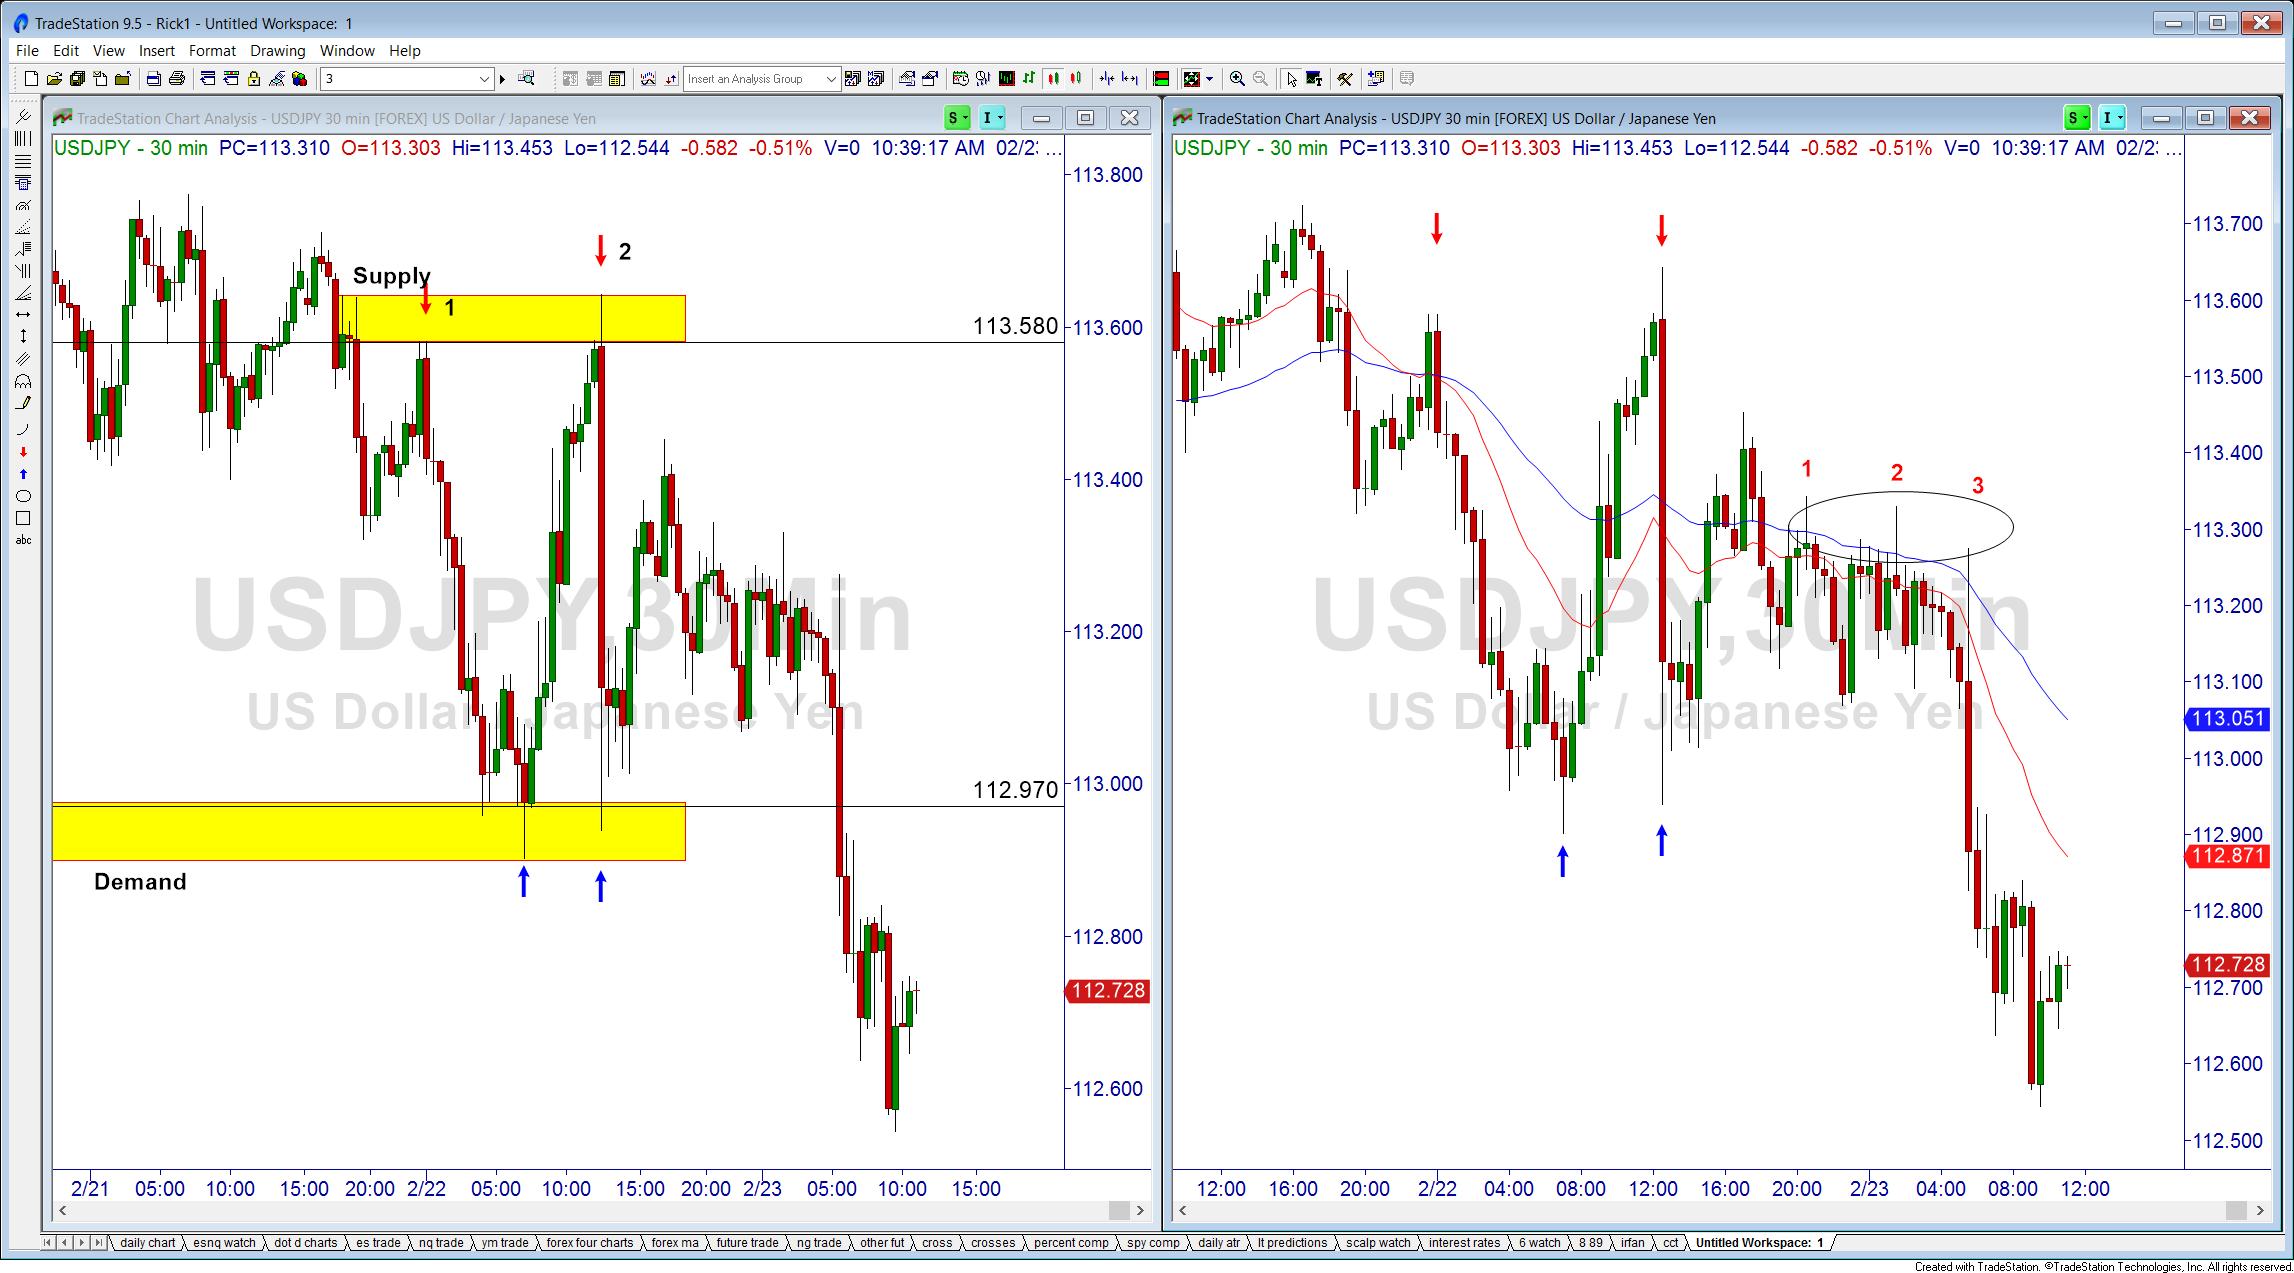
Notice where the red arrows are marked on the chart on the right. I haven’t seen a trading book yet that tells you to go short above a moving average like this! Now take a look at the blue arrows on the right-hand chart. How many trading books have you read that say to go long against the down-sloping moving averages? I would say none.
Let’s take this one step further. Using the rule mentioned earlier, some trading books suggest shorting when price moves up to the moving average. However, this only counts for the ENTRY. We also must be aware of our stop loss and profit target. Many trading book strategies tell you to place your stop loss just above the moving average that was used to enter the trade. Can you see a problem with this when looking at the red numbers 1, 2, and 3? Using that strategy, you would have been stopped out three times in a row! Not a great trading day…
So, the main take-away from this week’s newsletter should be this: all techniques have their time and place. But when and where are they? If you aren’t making money using them, they should obviously not be on your charts. Using supply and demand is the fastest way to get into and out of the market, when used with our entire core strategy.
This content is intended to provide educational information only. This information should not be construed as individual or customized legal, tax, financial or investment services. As each individual's situation is unique, a qualified professional should be consulted before making legal, tax, financial and investment decisions. The educational information provided in this article does not comprise any course or a part of any course that may be used as an educational credit for any certification purpose and will not prepare any User to be accredited for any licenses in any industry and will not prepare any User to get a job. Reproduced by permission from OTAcademy.com click here for Terms of Use: https://www.otacademy.com/about/terms
Editors’ Picks
EUR/USD nears 1.0800 on broad US Dollar weakness

Optimism continues to undermine demand for the American currency ahead of the weekly close. EUR/USD hovers around weekly highs just ahead of the 1.0900 figure.
GBP/USD reconquers 1.2500 with upbeat UK GDP

Following BOE-inspired slump on Thursday, the British Pound changed course and trades around 1.2530. Better-than-anticipated UK GDP and a weaker USD behind the advance.
USD/JPY holds positive ground around 155.50 on Fed’s hawkish comment

USD/JPY trades on a stronger note around 155.50 on Friday during the Asian trading hours. The renewed US Dollar demand lifts the pair. Nonetheless, the verbal intervention and the hawkish comment from the Bank of Japan’s Governor Kazuo Ueda might cap the downside of the Japanese Yen for the time being.
Editors’ Picks
EUR/USD nears 1.0800 on broad US Dollar weakness
Optimism continues to undermine demand for the American currency ahead of the weekly close. EUR/USD hovers around weekly highs just ahead of the 1.0900 figure.
GBP/USD reconquers 1.2500 with upbeat UK GDP
Following BOE-inspired slump on Thursday, the British Pound changed course and trades around 1.2530. Better-than-anticipated UK GDP and a weaker USD behind the advance.
Gold resumes advance and trades above $2,370

XAU/USD accelerated its recovery on Friday, as investors drop the USD. Dismal US employment-related figures revived hopes for a soon-to-come rate cut from the Fed.
XRP tests support at $0.50 as Ripple joins alliance to work on blockchain recovery

XRP trades around $0.5174 early on Friday, wiping out gains from earlier in the week, as Ripple announced it has joined an alliance to support digital asset recovery alongside Hedera and the Algorand Foundation.
Euro area annual inflation is expected to be 2.4% in April 2024

Euro area annual inflation is expected to be 2.4% in April 2024, stable compared to March. Looking at the main components of euro area inflation, services is expected to have the highest annual rate in April.
RECOMMENDED LESSONS
Making money in forex is easy if you know how the bankers trade!
Discover how to make money in forex is easy if you know how the bankers trade!
5 Forex News Events You Need To Know
In the fast moving world of currency markets, it is extremely important for new traders to know the list of important forex news...
Top 10 Chart Patterns Every Trader Should Know
Chart patterns are one of the most effective trading tools for a trader. They are pure price-action, and form on the basis of underlying buying and...
7 Ways to Avoid Forex Scams
The forex industry is recently seeing more and more scams. Here are 7 ways to avoid losing your money in such scams: Forex scams are becoming frequent. Michael Greenberg reports on luxurious expenses, including a submarine bought from the money taken from forex traders. Here’s another report of a forex fraud. So, how can we avoid falling in such forex scams?
What Are the 10 Fatal Mistakes Traders Make
Trading is exciting. Trading is hard. Trading is extremely hard. Some say that it takes more than 10,000 hours to master. Others believe that trading is the way to quick riches. They might be both wrong. What is important to know that no matter how experienced you are, mistakes will be part of the trading process.